
Why you'll be seeing more blue on some climate maps
Some of the maps and graphs that scientists use to communicate climate change are undergoing an update that might make it look like the planet just got cooler.
-- Comparing weather to climate --
At the end of every month or year, climate scientists use maps and graphs to show how our planet's most recent collection of weather observations compare to past months and years.
These maps and graphs, which are an important tool for monitoring our climate change, typically feature a mix of red and blue to show which months or years have been warmer/drier or cooler/wetter than average. These are called temperature and rainfall anomalies.
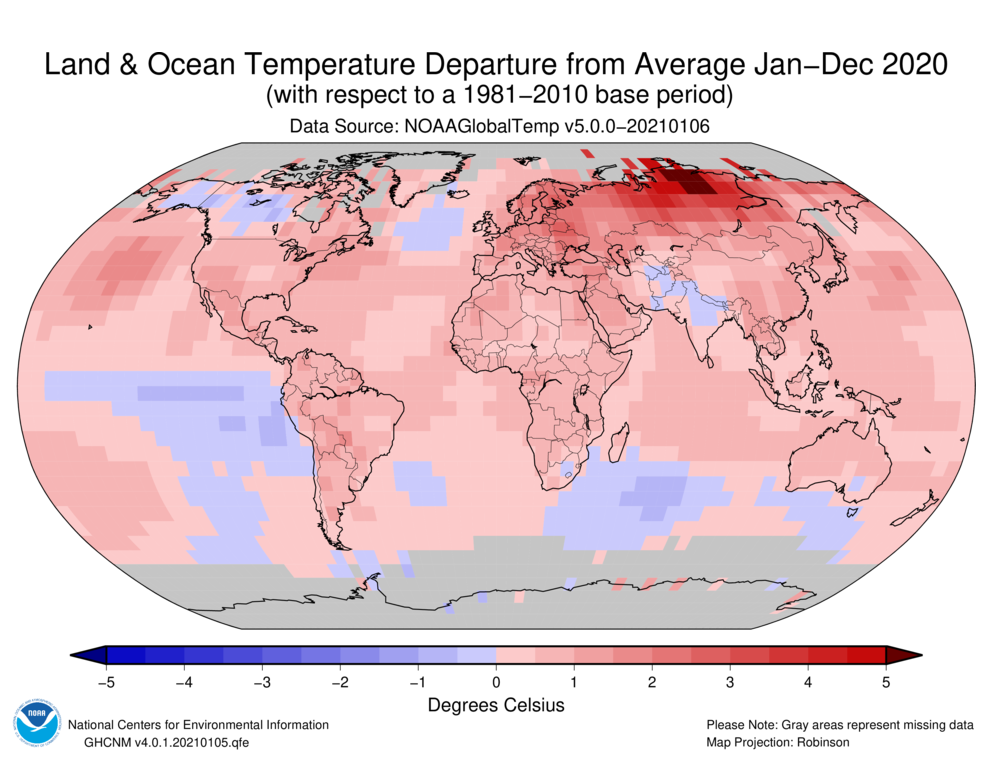
Image: Global surface temperature anomaly map for 2020 from the U.S. National Oceanic and Atmospheric Administration. Source: NOAA / NCEI
However, climate change has thrown a spanner in the works by altering what we consider to be the normal climate for any given city or country, and the planet as a whole.
-- What is a normal climate? --
The international standard for calculating the normal climate is to use a complete 30-year reference period. When monitoring climate change, The World Meteorological Organisation recommends using two separate 30-year 'climate normal' reference periods.
One of these reference periods is 1961-1990, which is a static period in history that acts as a benchmark for long-term climate change assessments between different countries and organisations. This is the 'climate normal' period that you see used on the Bureau of Meteorology's climate change maps/charts and in its latest State of the Climate report.
The other 'climate normal' reference period recommended by the WMO is the most recent 30-year period ending at the start of a new decade. Prior to this year, that reference period was 1981-2010. However, many organisations are now rolling over to the next reference period of 1991-2020, including Europe's Copernicus Climate Change Service and the U.S. National Oceanic and Atmospheric Administration.
While 1961-1990 can and should still be used to monitor long-term climate change, the 1991-2020 reference period gives us a more realistic idea of what the modern climate is like in each city, country and the planet as a whole. In practice, this contemporary reference period is more useful for farmers, businesses or governments that need to make decisions around what kind of weather conditions they can expect to see at any given time of year, in today's climate.
-- More blue, less red --
One of the consequences of updating the 'climate normal' reference period is that it raises the bar for what's considered 'normal' in terms of air temperature.
As a result, some maps and graphs that show temperature anomalies will immediately show more cold anomalies (blue) than warm anomalies (red), even though the absolute temperatures haven't changed.
The comparison below shows how the global surface temperature anomalies appear to change when switching the reference period from the 1981-2010 to 1991-2020.
Images: Comparing global and European January 2021 surface temperature anomalies using the 1981-2010 and 1991-2020 reference periods. Source: Copernicus CS3 / ECMWF
While this change might make it look like recent decades suddenly weren't as warm as they used to be, the actual temperatures haven't changed. The temperature of our planet's atmosphere has still changed remarkably over the last few decades.