


There are no active warnings for this location.
Weather Maps
Daily Forecast
Showers & storms are occurring in the NT's Top End, far north QLD & NSW's north & east in unstable easterly winds. Showers are scattering across VIC's south & Tas's west in onshore winds. Clear and settled elsewhere with high pressure.
Latest Warnings
AUS

Latest News

Climate Updates
Weather in Business

Latest News

17 Apr 2024, 6:41AM UTC
Dubai deluge: a year's rainfall in a day
Flights have been unable to land or take off from flooded runways, chunks of major roads have eroded away, while motorists have been trapped on inundated freeways as rare heavy rainfall lashed Dubai. More than 100 mm of rain fell within 24 hours across the desert city of almost six million people which is a popular stopover for Australians en route to Europe. That's more than the annual average of 94.7 mm. Torrential rains across the United Arab Emirates prompted flight cancellations, forced schools to shut and brought traffic to a standstill. The heavy rains that caused widespread flooding across the desert nation stemmed partly from cloud seeding.#Dubai pic.twitter.com/tbjFlTL2QQ — Muhammad Tanzeel (@DrTanzeel8) April 17, 2024 The cooler months from December through to March generally produce Dubai's heaviest rain, with almost no rain on average in the hotter months and an average of around 7 mm in April. Tuesday's unusually heavy rain was caused by "an extension of a surface low pressure system, accompanied by an extension of an upper air low pressure system" according to The National Center of Meteorology of the United Arab Emirates. Dramatic footage showed planes awash on the submerged tarmac of Dubai Airport. All aircraft movements stopped for two hours on Tuesday evening with airport authorities urging travellers to check the status of flights through their airline. ??We advise you NOT to come to the airport, unless absolutely necessary. Flights continue to be delayed and diverted. Please check your flight status directly with your airline. We are working hard to recover operations as quickly as possible in very challenging conditions. — DXB (@DXB) April 17, 2024 Wednesday has dawned cloudy in Dubai and while torrential rain has ceased, schools have been shut across the city with the government encouraging workers to work remotely. In neighbouring Oman, flash floods had claimed 18 victims, authorities said, while nearby Qatar and Bahrain also experienced moderate to heavy rainfall. Torrential rains across the United Arab Emirates prompted flight cancellations, forced schools to shut and brought traffic to a standstill. The heavy rains that caused widespread flooding across the desert nation stemmed partly from cloud seeding.#Dubai pic.twitter.com/tbjFlTL2QQ — Muhammad Tanzeel (@DrTanzeel8) April 17, 2024 In late 2023 Dubai hosted COP28, the United Nations Climate Change Conference, at which climate scientists warned that climate change would make flooding events in some arid parts of the world more severe when they occurred. Image: A partially flooded road in Dubai in another heavy downpour in 2020. Source: Katiekk2 via iStock.
17 Apr 2024, 1:37AM UTC
Melbourne weather strongly out of character
"If you don’t like the Melbourne weather, just wait five minutes." So goes one of many sayings about Melbourne's famously changeable weather, which can swing wildly from minute to minute, hour to hour, and day to day. But for the past two weeks, Melbourne’s weather has been behaving in a decidedly un-Melbourne-like manner. In short, it has been extremely steady and predictable. READ MORE: REMARKABLY UNREMARKABLE WEATHER April 2024 started with a surge of warm air and a top temperature of 28.2°C before dipping to a maximum of just 16.6°C on April 3. That was a taste of the fluctuating Melbourne weather so many people know and love. Or even if we hate it, we love to hate it because it's just so very Melbourne. But since April 3, there has been a remarkably uniform pattern to the daily maximums, which have peaked just below 20°C most days, with a couple of days where the mercury tipped over 20°C. (You can view our daily summaries here) And for the rest of this week, the trend of coolish Melbourne max temps just below 20°C is set to continue with highs of 17°C, 18°C, 18°C, 18°C and 18°C predicted from Wednesday through to Sunday. We should also mention that Adelaide has also seen a month remarkably free of dramatic temperature fluctuations, with a lowest maximum of 18.8°C and a highest max of 22.8°C to date. Why the steady daytime temps? We've written often in recent weeks about the influence of the persistent blocking highs centred south of Australia. These systems continue to prevent much-needed rain-bearing cold fronts from reaching southwest WA, where a record-breaking dry spell continues, and they also tend to bring stable weather to Victoria and South Australia. We could literally pick the synoptic chart from almost any day this month to illustrate this situation and Wednesday's chart will do nicely. That strong high centred south of the Bight is delivering generally fine weather to almost the entire country. It’s also pushing southerly winds the way of Adelaide and Melbourne which explains why average max temps for both cities are ever so slightly down on average for April 2024 to date. Only very light showers are affecting Australia's southern coastline so in both Melbourne and Adelaide, you can expect cool but stable conditions for the rest of the week. If you're a Melbourne or Adelaide local, enjoy the current lack of uncertainty in the weather! As we all know, it's certain not to stay that way.

16 Apr 2024, 5:03AM UTC
BoM declares El Niño over
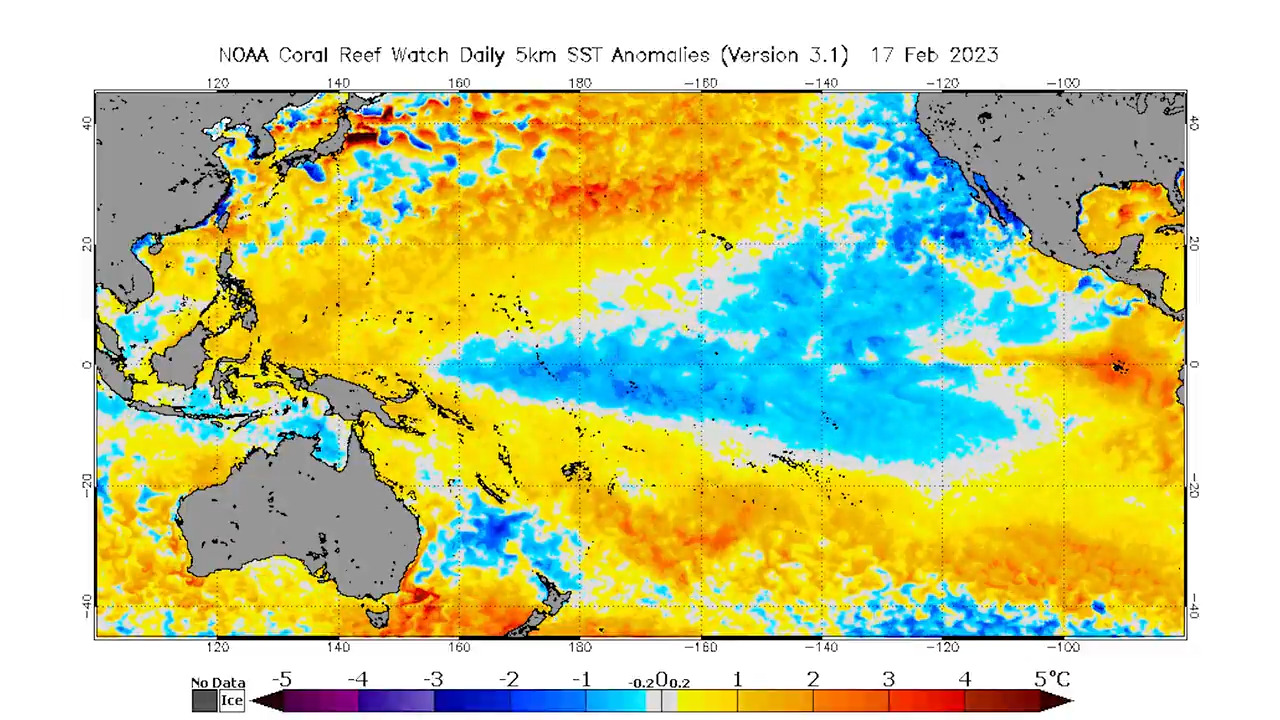
The Bureau of Meteorology has officially declared El Niño over and the El Niño Southern Oscillation (ENSO) is now inactive for the first time since 2021, meaning there is no immediate sign of either an El Niño or a La Niña event. "El Niño has ended and the El Niño–Southern Oscillation (ENSO) has returned to neutral. Climate models indicate ENSO will likely continue to be neutral until at least July 2024," the BoM said in a statement on Tuesday. "As the current global ocean conditions have not been observed before, inferences of how ENSO may develop in 2024 that are based on past events may not be reliable." The story of the 2023/24 El Niño event Many Australians tend to associate El Niño with uniformly dry weather across the country, however this is not always the case and was definitely not the case over the duration of the 2023/24 El Niño event. El Niño’s influence on Australia’s climate was clear in late winter and early spring 2023, leading to the driest three-month period on record across Australia from August through to October 2023. The swift end to a moderate Australian snow season as well as severe rainfall deficiencies in large parts of southern Australia were just two clear-cut effects of the widespread dry conditions. This remarkable dry period was then followed by widespread rain and thunderstorms across eastern and southeastern Australia during summer, highlighting that El Niño’s influence is strongest during spring and that it does not always lead to dry weather, especially when other climate drivers were at play. A myth busted: El Niño years always mean dry summers The map below shows the summer rainfall deciles during 14 El Niño years, showing that during El Niño years much of the country can expect average to above average rainfall. Note just how much of the country is close to average during the summer months, with some parts even seeing a wetter than normal tendency. Image: Summer mean rainfall deciles for 14 El Niño years, source: BOM The return of wet weather in summer and Autumn was caused by the waning influence of El Niño, a positive phase of the Southern Annular Mode (SAM) and record-breaking warm sea surface temperatures off the east coast of Australia. The map below shows that during the during the last five months that much of Australia saw above average rainfall, except the west coast. Source: BoM. The record-breaking sea surface temperatures across northern Australia, also led to an unusually active end to the tropical cyclone season despite El Niño. Eight tropical cyclones have formed in the Australian region so far this season, with computer models showing another two possible in the next week. The average for an El Niño is around seven. The latest weekly Nino 3.4 value up to Monday, April 15, was +0.64°C, which has fallen below the El Niño threshold of +0.8°C. This means that the Pacific Ocean has returned to a neutral or normal phase, no longer influencing Australia’s weather. El Niño was declared in mid-September 2023 by the Bureau of Meteorology and as mentioned, it quickly became a strong event during November and December 2023. This contributed to the driest three-month period on record for Australia between August and October 2023. While the BoM forecasts that neutral conditions should continue through the remainder of autumn and into winter, three out of seven global meteorological organisations give La Niña of developing later this year. The US Climate Prediction Centre (CPC) and Columbia University’s International Research Institute for Climate and Society (IRI) give La Niña an 80 percent chance of occurring by late winter/early spring and an 86 percent chance in late spring and early summer. Image: El Niño-Southern Oscillation (ENSO) forecast for the next 10 months, according to the U.S. CPC/IRI. The blue bars show the probability of La Niña occurring during each three-month period, with grey and red bars representing the probability of neutral and El Niño, respectively. Source: CPC/IRI The warm oceans and humid atmosphere that are associated with La Niña typically drive above average rainfall and cloud cover across much of Australia, especially between winter and early summer. Image: Observed rainfall deciles during 12 past La Niña winter-spring periods combined, showing that large areas of Australia typically experience above-average rain during La Niña. You can read more about the impacts of La Niña on Australia's weather here.
Weather in Business

03 Apr 2024, 4:35AM UTC
Solar booms as Adelaide records sunniest March in 30 years
Southern Australia saw an abundance of clear skies during March, causing rooftop solar to soar to new heights. The run of sunny days was caused by blocking high pressure systems that prevented cloud and rain bearing cold fronts from sweeping across southern Australia. The clear skies led to Melbourne recording its driest March on record with a measly 2.8mm total, beating the previous record of 3.7mm in March 1934. Adelaide was also dry, recording 27 days without a drop of rain, while Sydney picked up 52.5mm of rain and Brisbane 152.8mm. Across the four major NEM capital cities: Melbourne saw its sunniest March in 18 years, with an average of 8.5 hours of sunlight each day. Adelaide recorded the sunniest March since 1994, averaging 10.4 hours of sunshine per day. Sydney observed an average of 7 hours of sunlight per day, which is the most sun hours the city has seen in two years. Brisbane was the cloudiest of these cities with only 5.7 hours of sunshine on average per day, consistent with above average rain falling in the city. The lack of cloud and rain across southern Australia led to increased rooftop solar output across the region in March 2024. Data from OpenNEM shows that rooftop solar in Victoria was the highest on record this March since rooftops installations begun in 2007. The graphs below show the warm season rooftop solar contribution to the National Electricity Market (NEM). Images: Warm season (October- March) rooftop solar power (GW/h). Data sourced: OpenNEM, AEMO, APVI. The rising trend in the graph above for VIC looks remarkably similar for SA, with March 2024 producing 294 GWh / month across the state, compared to 252 GWh / month from March 2023. The graph also highlights that the total solar generation has been increasing year-on-year since 2018, driven by a boom in solar installations across Australia. The Clean Energy Council reported that in 2023, renewable energy supplied a record 39.4% of Australia's electricity, led by wind's 13.4% share. Rooftop solar cracked a 10% share for the first time, reaching 11.2% ahead of solar farms at 7% and hydro's 6.5% share. During March 2024, rooftop solar across SA supplied 24.5% of SA’s energy needs, the largest in the NEM. Meanwhile renewable energy contributed 77% of SA’s power, with wind taking the lead with a 43.5% contribution. Image: March contribution to renewables in SA, Vic, NSW, Qld, Data sourced: OpenNEM, AEMO, APVI. Rooftop solar is the leading renewable across NSW and Qld, contributing between 11 and 12 percent to the state's energy needs, followed by solar farms then wind. Weatherzone Business and Solcast are a market-leading partnership delivering highly specialised solar data to the Australian renewable energy industry. Designed for utility scale solar sites, we offer you a globally proven solution. With low upfront CAPEX and powerful cloud-based information systems, you can access a complete suite of irradiance and weather data to ensure forecast accuracy and improve site efficiency. Solcast is the world leader in real-time actuals and rapid-update solar forecasts. This solution utilises Solcast’s centralised Amazon Web Services’ (AWS) cloud infrastructure for all complex algorithmic processes and data plumbing. You will gain the power of AWS to interpret and deliver your data at top speed, providing real-time, historical and forecasting estimates direct to your API. Receive monitoring and support from the Weatherzone and Solcast teams, 24/7. For more information, please contact us at business@weatherzone.com.au.
31 Jan 2024, 5:54AM UTC
Powerful waves to impact port operations
Deceptively powerful surf is forecast for this weekend, as heavy waves originating from the Southern Ocean hit the NSW coastline. The heavy surf will be whipped up by a low-pressure system sweeping across the south of the continent later this week. The map below shows wave heights of 3-4m are expected across the central and southern NSW coast on Friday and Saturday. Image: Significant wave height forecast at 5pm Saturday, February 3 according to Wave Watch III In Sydney waters, wave heights are forecast to peak at 4 to 4.5 metres on the weekend. These wave heights will create very rough seas off the Sydney and Illawarra coasts on the weekend. While the waves will be large, it's the wave period that will generate the deceptively powerful surf. Wave period is the average time between crests (or troughs) of waves. The larger the time difference, the greater the amount of energy associated with the waves or swells. The wave period should reach 10-12 seconds along the Sydney coast and south on Saturday. The map below shows the high period waves impacting the central and southern coastline on Saturday. Image: Wind wave period at 4pm on Saturday, February 3, according to Wave Watch III Looking ahead, the long period swell should move offshore by Monday easing conditions along the NSW coastline. Weatherzone Business offers a comprehensive suite of services, refined through years of collaboration with the marine, ports and offshore industries, to optimise the safety and efficiency of your operations. For more information, please contact us at business@weatherzone.com.au.

